After seasonal adjustment, 1,971 companies became insolvent in January 2025, up 6% from December 2024 and 11% from January 2024. After three years, the average absolute change between consecutive months has been 12%.
After declining in the early 2000s, company insolvencies soared during the 2008-09 crisis. Government support measures during the COVID-19 epidemic in 2020 and 2021 reduced monthly volumes to their lowest ever. Creditor Voluntary Liquidations (CVL) numbers rose above pre-pandemic levels in 2022, although compulsory liquidations and administrations remained low. CVLs reached a record high and compulsory liquidations matched 2015-19 levels in 2023, bringing insolvency numbers to a 30-year high. The 2024 total was slightly lower than 2023 because CVLs decreased more than other insolvency categories.
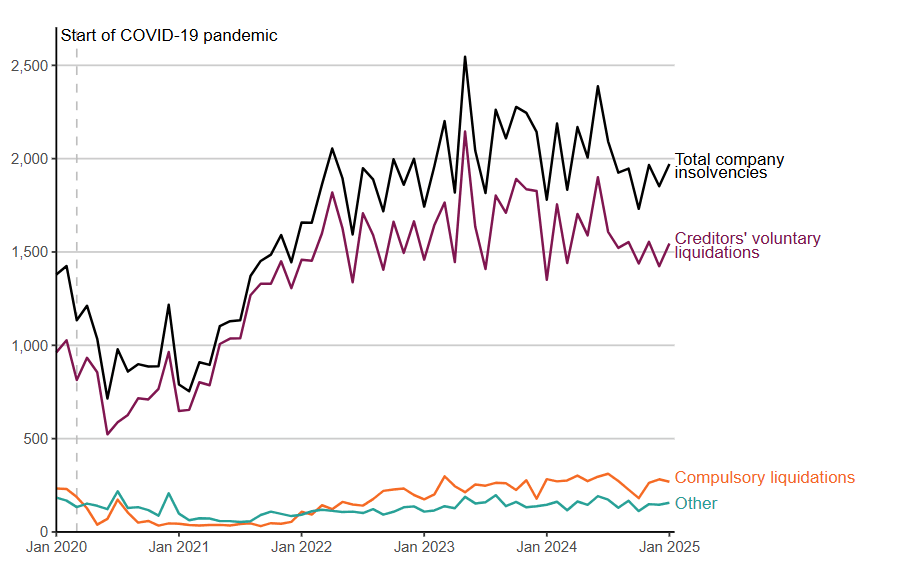
Figure 2: Company insolvencies during the second half of 2022 have reached 2008-09 recession levels.
English and Welsh monthly firm insolvencies by type, January 2000–January 2025, seasonally adjusted.

CVLs
CVLs represented 78% of company insolvencies in January 2025. CVLs rose 9% from December 2024 and 14% from January 2024 after seasonal adjustment.
Compulsory liquidations
The seasonally adjusted number of compulsory liquidations in January 2025 was 5% fewer than in December and January 2024.
Administrations
January 2025 saw 10% more administrations than December 2024 and 9% more than January 2024 following seasonal adjustment.
CVAs
The number of CVAs decreased by 13% in January 2025 compared to January 2024 and 18% from December 2024. Numbers remain low compared to historical levels.
There were 9% more CVAs in 2024 than in 2023 and approximately 80% more than in 2022, which had the lowest yearly total since 1993. Despite this increase, 2024’s number was just under 60% of the 2015–2019 average.